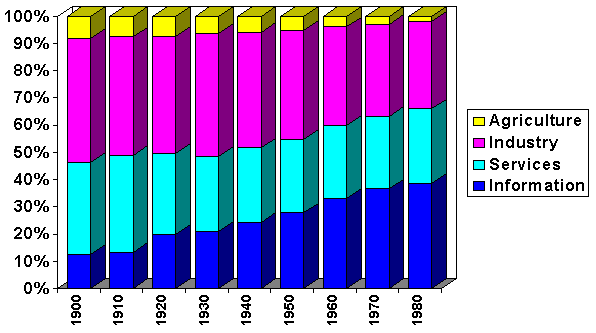
Source: Dordick and Wang (1993)
		1900	1910	1920	1930	1940	1950	1960	1970	1980

Information	12.4	13.3	19.8	20.9	24.4	27.8	33.1	36.6	38
Services	34	35.7	29.7	27.5	27.3	27.1	26.9	26.7	26.9
Industry	45.4	43.4	43.2	45.2	42.6	39.9	36.1	33.7	31.5
Agriculture	 8.2	 7.6	 7.3 	 6.4	 5.8	 5.2 	 3.9	 3	 2